|
APPLICATION: The Productivity Report is an Involves Stage’s feature meant to let you monitor your field team through average visit time indicators in each point of sale and the time spent on each survey. REQUIRED READINGS: Surveys Pane, Surveys Answers. |
Involves Stage allows you to track the productivity rate of your team in relation to their execution time on the field. Using the Productivity Report feature, you can access your operation progress, compare it to other periods and analyze the average visit time at each point of sale and the time spent on each survey.
You can access this resource following:
Menu > Communication and Monitoring > Reports > Productivity Report
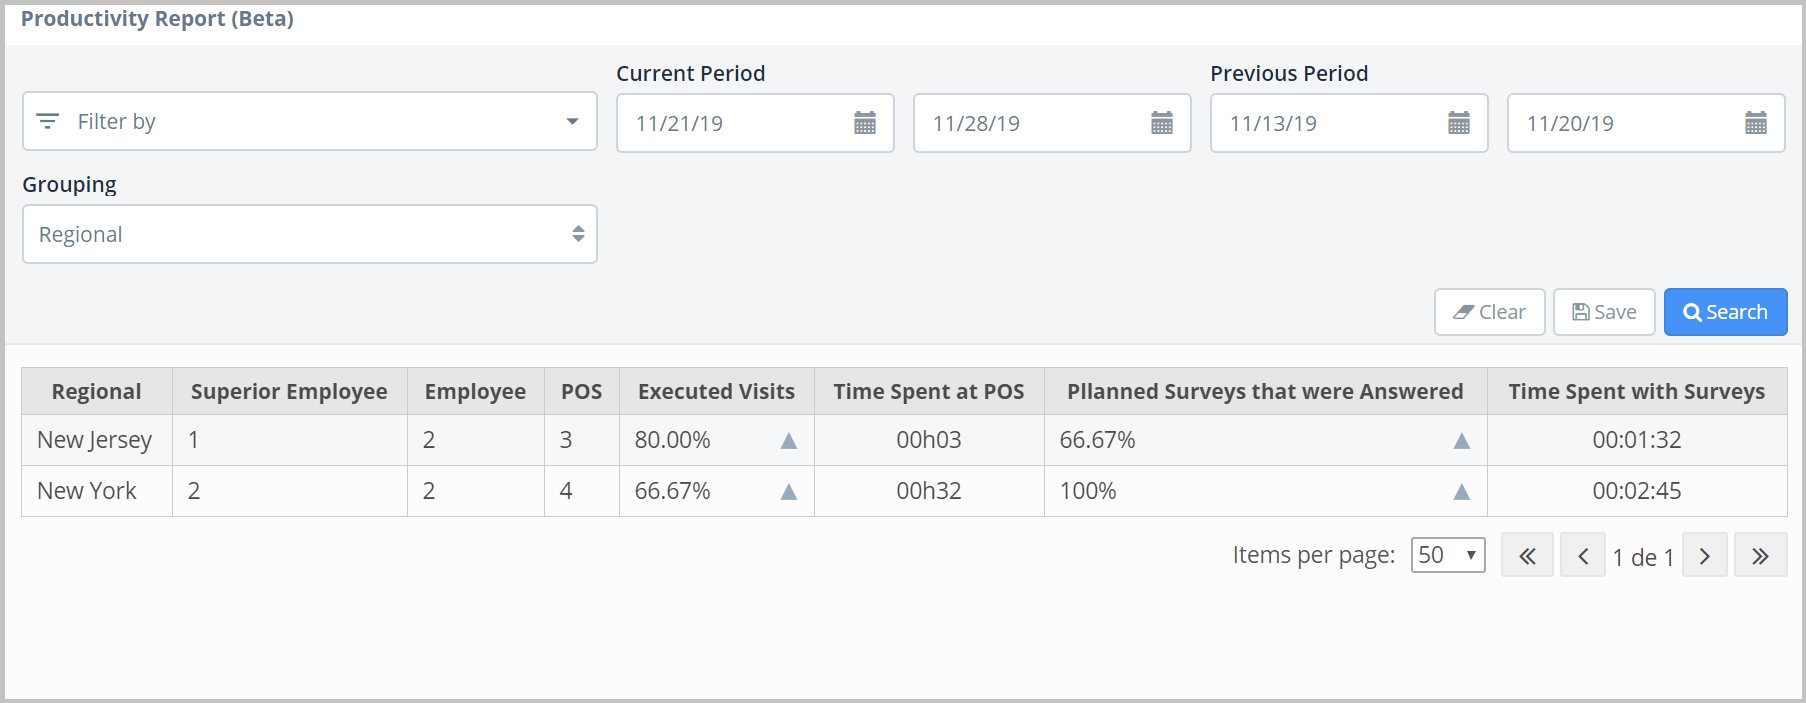
When you access the Productivity Report you’ll find a table with information like:
- Executed Visits showing the percentage of visits completed during the selected period compared to the number of planned visits on the itinerary.
- Time Spent at POS shows you the average time spent visiting a POS.
- Surveys Responded shows you the percentage of surveys responded during the selected period.
- Time Spent on Surveys displays the average time spent responding all the scheduled surveys.
By default, the page presents previous week’s indicators (7 days) in relation to the same earlier period and grouped by regional.
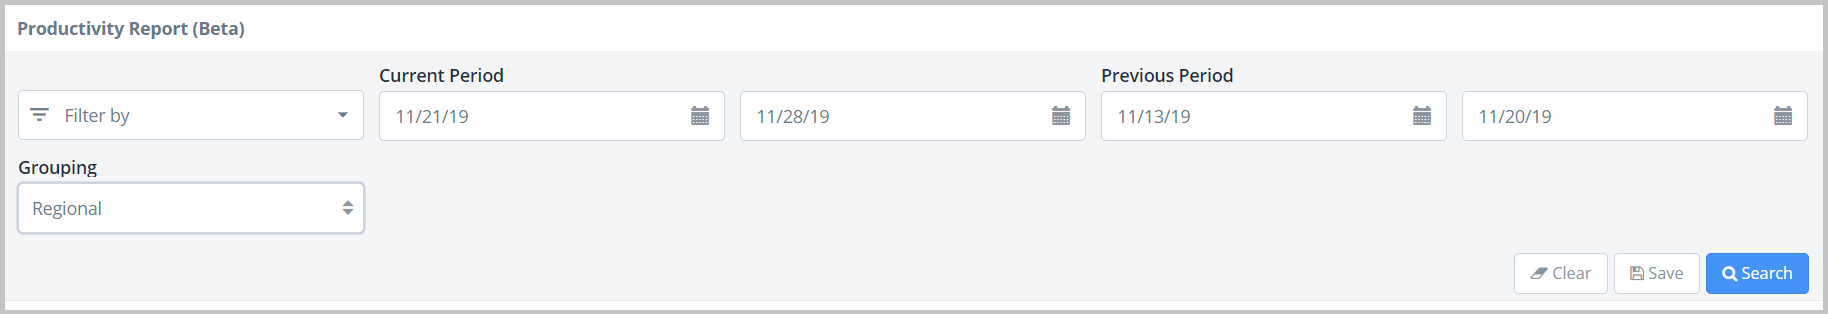
You can refine the presented data by features using the filters available on the page like Current Period and Previous Period - where you can select the date for comparison.
You can also set grouping filters when researching. You may chose:
- Regional
- Superior
- Employee
- Point of Sale
Choosing one or another grouping will affect the data displayed on the table. Check it out:
|
Grouping |
Data Displayed |
|
|
Regional |
Name of the Regional; |
|
|
Superior |
Regional where the employee is registered; |
|
|
Employee |
Regional where the employee is registered; |
|
|
Point of Sale |
Regional where the POS is located; |
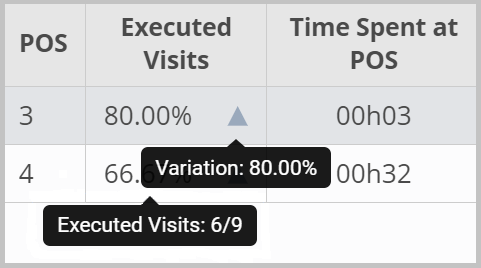
This resource will also display variation icons. Relating them to the percentage increase and decrease according to other analyzed periods. Moving the cursor over the icons you can see the variation details.
When there’s no comparative data, this resource will not show any indicators. It happens when a new point of sale was recently added or during the extraction of data consolidated with no comparative.
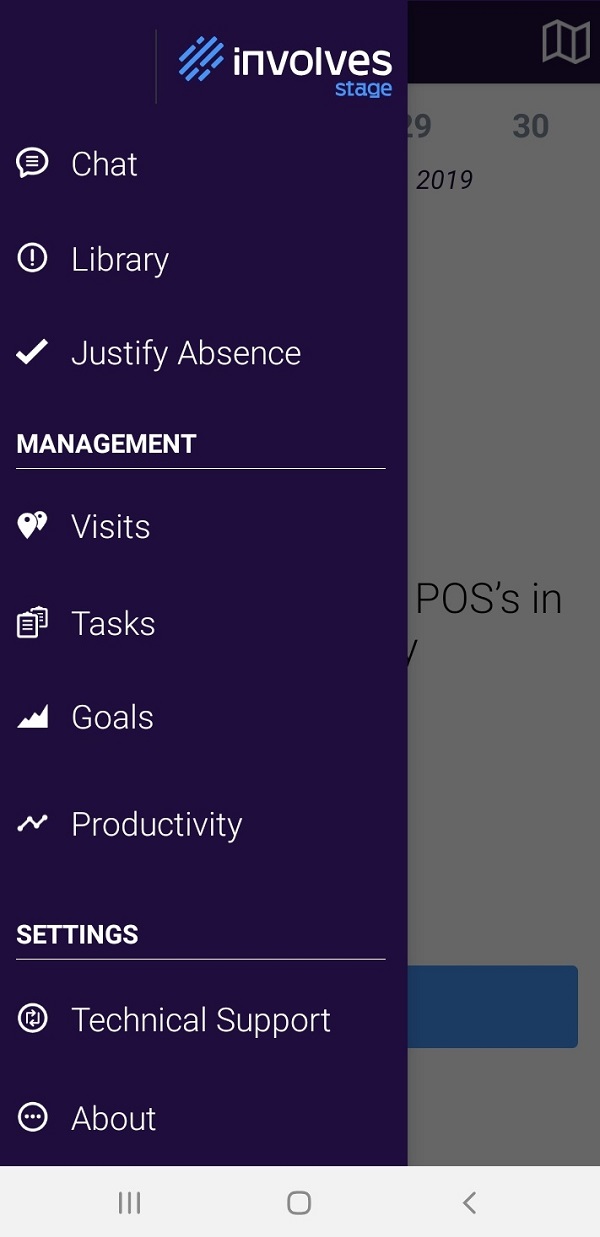
You can also access this data in an optimized way on mobile platforms. Using the Productivity resource, supervisors can monitor their team’s performance from anywhere. The feature on the App works the same way shown on Productivity Report.
ON THE APP
Productivity Report can also be accessed by Supervisor access profiles on the app.
|
Note All data shown on the Productivity Report can only be accessed when permission to view regionals is active. The user will only be able to see the information related his/her regional. The system administrator can access all available data. If you couldn’t find this resource when accessing Involves Stage, please contact your system administrator to grant you permission on your Access Profile settings by selecting the Write or Read option on the Permissions for Web Access Profile on the Productivity Report resource. |
Comments
Article is closed for comments.